
2021 Restaurant Trend Report


Restaurant
Trend Report
After a challenging year in 2020, the restaurant industry needed a bounceback in 2021. Instead, it got a year that was equally hard to navigate.
But despite the supply chain disruptions, COVID-19 Delta variant and unprecedented worker shortage that crippled pandemic recovery, restaurant owners refused to throw in the towel, doing everything they could to keep diners in good spirits and balance sheets in the black.
Through the lens of our 8,000+ restaurant partners, here is how the industry has evolved in this difficult year.
Rising Operating Costs Force Restaurants to Find New Efficiencies
According to the National Restaurant Association, 91% of restaurants paid more for food this year, 84% paid more for labor and 63% paid more for real estate. As the already-thin margins of their industry grew thinner, restaurant owners pivoted to stay profitable.
MENU STREAMLINING75%of restaurants changed menu items due to supply chain issues¹ | PRICE INCREASES59%increase in cost per cart item on catering orders | COVID SURCHARGES38%increase in COVID surcharges applied to online orders |
GHOST KITCHENSGhost kitchens have lower operating costs and more operational flexibility than brick-and-mortars do. This has helped sustain their growth beyond the initial phase of the pandemic, when indoor dining was unavailable. Market research firm Euromonitor projects the ghost kitchen industry could be worth $1 trillion by 2030. | Fastest-Growing StateFlorida↑ 500% ghost kitchens in 2021 Fastest-Growing CuisineBurgers↑ 400% ghost kitchens in 2021 |
100%
increase in the number of ghost kitchens on BentoBox
¹National Restaurant Association, “Economic Impact Survey.” September 2021.
“New Normal” Begins to Emerge Beyond the Pandemic
Dining rooms and offices are open across the country. As people emerge from their homes and re-enter the world, they are defining what the “new normal” looks like for diners. Restaurants that understand and react to the shifting landscape will be rewarded.
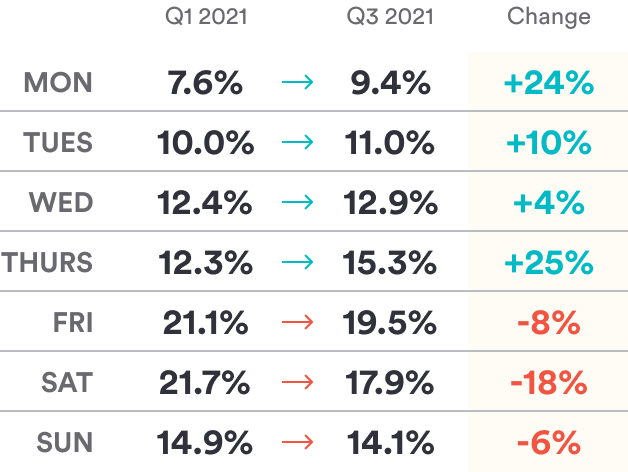
Change in Weekday
Lunchtime Revenue (May-Sep 2021)
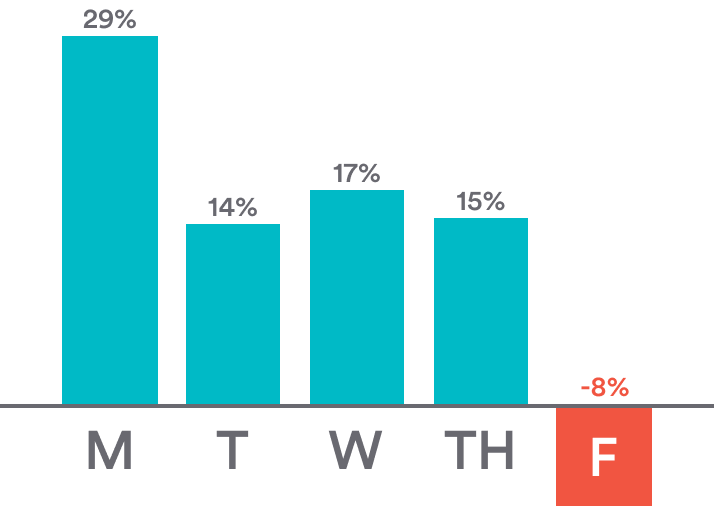
Beginning in May, when a majority of Americans had received their first vaccine dose, weekday lunchtime revenue showed signs of bouncing back.
This signals that workers are returning to offices, but the bounceback has not been even across workdays. The growing trend of hybrid work may continue to keep people home on Fridays.
Online COVID-19
Donations by Quarter
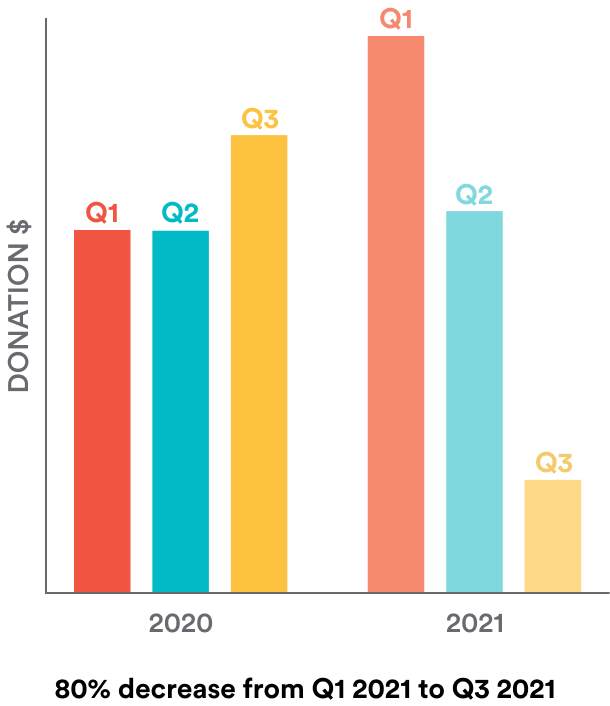
Even though indoor dining has returned, the restaurant industry remains in dire straits. Unfortunately, many consumers think the “crisis” phase of the pandemic is over.
Restaurants should expect far less direct support from diners than they received when indoor dining was restricted.
Rise of
Online Ordering
↓ 50%
decrease in diner preference
for third-party ordering apps
PAST SIX MONTHS
↑ 54%
increase in direct online
order volume
YEAR OVER YEAR
One way diners are supporting restaurants is through direct online ordering. In a span of six months, the percentage of diners who prefer third-party ordering apps was cut in half.
But diners aren’t just claiming to embrace direct ordering in surveys: They’re backing it up with a 54% rise in direct online ordering volume.
Outdoor Dining & Streeteries
Outdoor patios and dining space expansions, approved as part of pandemic relief, proved popular with diners and restaurant owners — resulting in a groundswell of support to make them permanent.
Legal and political battles may slow this process in some areas, but outdoor dining will continue to serve an expanded role for restaurants moving forward.
Restaurant Technology (Slowly) Becomes Less Fragmented
The right combination of technology makes restaurants leaner, faster and more profitable. However, fragmentation has made it difficult for restaurants to find the right tech stack for their needs. The pandemic cast a light on this issue, leading restaurants to demand and embrace integration.
484%
increase in share of BentoBox restaurants licensing 4+ features
past 12 months
A snowball effect occurs when restaurants begin to leverage connected technologies. The benefits are clear and obvious, which leads the restaurant to license more and more features (online ordering, event management, gift cards, etc.) from the same vendor. This group of integration “super users” has grown substantially in the past 12 months, and will continue to grow in 2022.
Percent of BentoBox Restaurants
Licensing 4+ Features
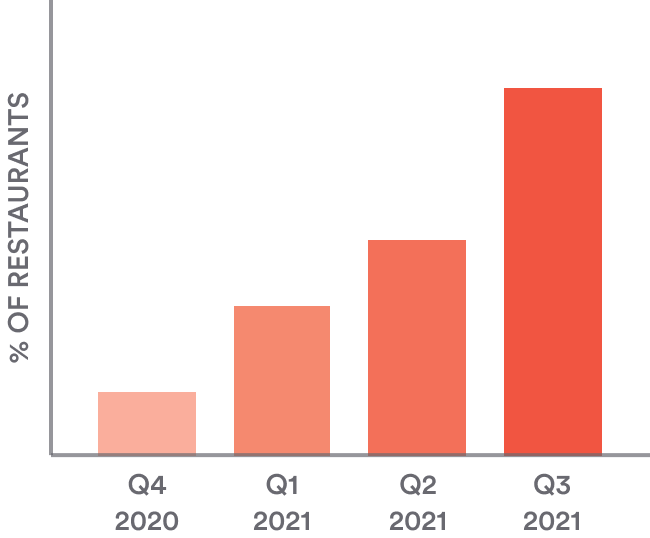
Features include website design, online ordering, event management and other discrete BentoBox products.
“While restaurant technology has rapidly advanced since the start of the pandemic, it has done so piecemeal, with often incompatible solutions rising to the fore, leaving restaurants to navigate a disorderly tangle of digital tools.
Now, as restaurants aim to make their digital presence a more permanent fixture of their business, tech providers are racing to meet as many of restaurants’ digital needs as possible with comprehensive, connected systems.”
PYMNTS.com | October 18, 2021
Restaurants Take Ownership of Online Guest Relationships
For years, third-party ordering apps have dominated the digital dining landscape. They have used this dominant market share to nickel-and-dime restaurants with steep commissions. During the pandemic, restaurants started fighting back — and it’s working.
1,100+
BentoBox restaurants began offering direct online ordering
$38.5 million
Saved in commission fees through direct online ordering*
You read that number correctly. In the last 12 months, BentoBox restaurants saved $38.5 million that would have otherwise gone to third-party apps.
Building a custom website with optimized online ordering was once viewed as an expense, but more and more restaurants now see it as an investment.
*Assuming a 30% commission fee on third-party ordering
200%increase in monthly revenue from digital loyalty programs PAST SIX MONTHS | 193%increase in quarterly revenue from email marketing campaigns PAST TWELVE MONTHS |
Owning the digital guest relationship doesn’t end when a diner places an order. With the right technology, restaurants can use automated emails and digital loyalty programs to increase the lifetime value of each diner. Third-party ordering apps have utilized these tactics for years, but restaurants are starting to catch up.
Online Ordering Trends Reflect Changing Landscape
Before the pandemic, online ordering was a secondary source of revenue. During the pandemic, it was basically the only source of revenue. As it settles into its future role — somewhere between those previous two — several important trends are emerging.
Percent of Online Orders by Day
Weekends have long been the main days for online ordering. That’s still the case, but the gap between weekends and weekdays shrunk considerably in 2021.
Online ordering has become a routine part of peoples’ lives, rather than a “treat” saved for weekends.
Biggest Increase in Orders by Cuisine
 Seafood +187% |  Bakery +128% |  Mexican +112% |
Seafood is typically considered a cuisine that doesn’t “travel well,” but the pandemic forced seafood restaurants to innovate and change that perception.
It appears to be making an impact, as no cuisine saw a greater increase in orders than seafood did.
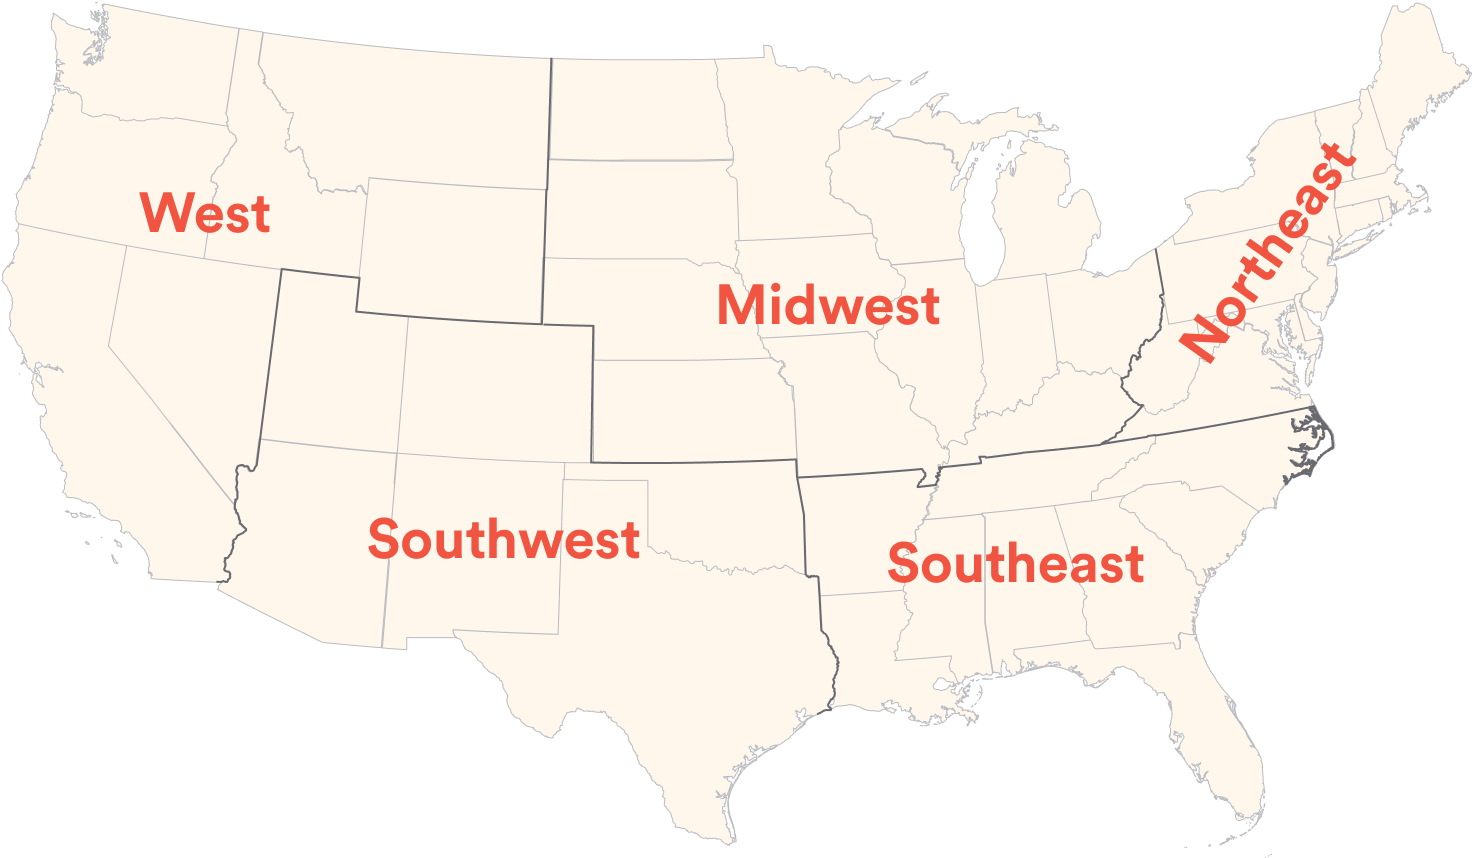
Most Ordered Dishes by Region
Click the tabs below to view each region’s top dishes.
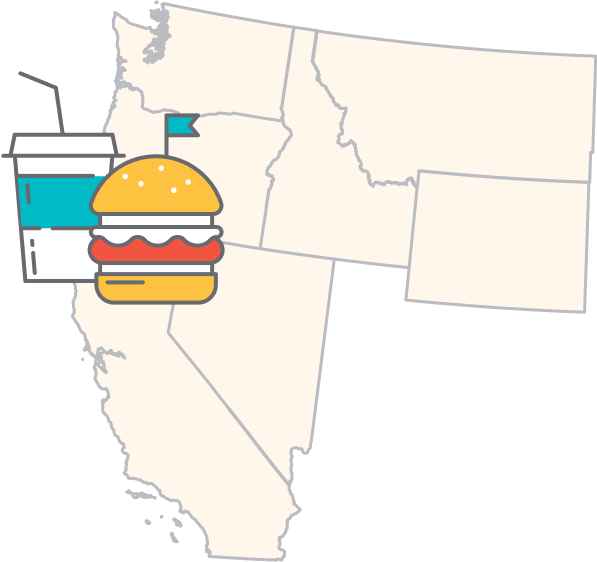 | West1. Burgerburger., Santa Cruz, CA 2. Tea Leaf SaladBurma Superstar, San Francisco, CA 3. Build Your Own 18" PizzaAtlas Pizza, Portland, OR |
 | Midwest1. Cinnamon RollLost Larson, Chicago, IL 2. Honey Butter BixPenny Red's, Detroit, MI 3. Brown Butter-Glazed DoughnutBogart's Doughnut Co., Minneapolis, MN |
 | Southwest1. Craft MeatballsThe Sicilian Butcher, Phoenix, AZ 2. "The Mikey" House-Made PizzaEsters, Denver, CO 3. Tender TrioCrazi's Hot Chicken, Tempe, AZ |
 | Southeast1. New York PizzaNew York City Pizza, Charleston, SC 2. GSW Rice BowlGan Shan West, Asheville, NC 3. Momonoki TonkatsuMomonoki, Atlanta, GA |
 | Northeast1. Birria TacoChofi Taco, Union City, NJ 2. Roasted SalmonRumi's Kitchen, Washington, DC 3. Pastrami, Egg & CheeseFrankel's Delicatessen, Brooklyn, NY |
Emerging Trends to Watch in 2022
The biggest trends of the past two years have emerged in response to COVID-19, which made them difficult to forecast. As the world and industry slowly begin to stabilize, it’s easier to look forward and plan ahead. Here are five emerging areas to keep an eye on in 2022.
 | Restaurants Evolving as EmployersIn June, 75% of restaurants called hiring and retaining staff their top business challenge — nine times higher than in January. The expiration of federal unemployment benefits did little to solve this issue, because this issue can only be solved from within. If restaurant owners want to hire and retain staff, they need to make restaurants a better place to work. Expect new ideas and strategies to emerge throughout next year. |
 | Automation Solving Staffing IssuesEven with higher wages, better benefits and healthier workplaces, staffing levels may take years to normalize (if they ever normalize at all). Allowing technology to handle more tasks — especially tedious ones, like keying in orders — allows restaurants to operate with fewer, happier, higher-paid employees. Restaurants began embracing this during the 2021 staffing shortage, and will likely continue moving forward. |
 | Creative First-Party Data Solutions“If you think of a restaurant tech stack as the human body, data is like the blood. A system with poor circulation is therefore limited.” This idea, which an unnamed restaurant operator shared with Joe Guszkowski of Restaurant Business, captures the industry’s growing embrace of data-driven solutions. As restaurants reclaim ownership of the online guest experience, expect them to develop new ways of synthesizing, analyzing and reacting to the first-party data they capture. |
 | Evolution of Food DeliveryOffering direct online ordering and providing a reliable delivery experience used to be key differentiators. As those things become more like table stakes, restaurants are searching for new ideas to make their off-premise offerings stand out. Areas to watch next year include packaging innovation and ultra-fast delivery, the latter of which has begun taking shape with the rise of 15-minute grocery delivery apps. |
 | Rise of Alternative Menu ItemsEleven Madison Park, the Manhattan restaurant that some have called the best in the world, sent a jolt through the industry when it announced in May that it was transitioning to a meatless menu. It was the largest, but far from the only, domino to fall in the industry’s shift toward more sustainable menu items. Will diner demand for meat, dairy and other ingredient alternatives hit a tipping point in 2022? |